Unit economics sound like startup jargon, but the questions they answer are pure Main Street: what is one customer worth, what does one cost to win, and how fast does that money come back? Three numbers, three mistakes to avoid, and a map that tells you what to do next.
LTV — on gross profit, never revenue
Customer Lifetime Value = monthly gross profit per customer ÷ monthly churn.
The #1 mistake: computing LTV on revenue. A $290/month customer at a 55% gross margin is worth $159.50 a month — and at 4% monthly churn (an average lifespan of 25 months), their LTV is about $3,990, not the $7,250 the revenue math suggests. Most owners overestimate LTV by 2× exactly this way.
CAC — fully loaded
Customer Acquisition Cost = total monthly sales + marketing spend ÷ new customers per month.
The #2 mistake: counting only ad spend. Salaries, commissions, tools, agencies, content — leave them out and you'll understate CAC by 40–60% and scale a funnel that quietly loses money.
The ratio — and the mistake on the other side
| LTV:CAC | Meaning |
|---|---|
| Under 1:1 | You lose money on every customer |
| ~2:1 | Thin — fix before scaling |
| 3:1 | The healthy benchmark |
| 4–6:1 | Strong, scale-ready |
| Above ~5–8:1 | Probably under-investing in growth |
That last row is the #3 mistake: a sky-high ratio isn't bragging rights, it's a signal you could profitably spend much more on acquisition.
Payback — because cash timing kills faster than ratios
CAC payback = CAC ÷ monthly gross profit per customer. Under 12 months is excellent; over 24 is a warning even when the ratio looks great — growth eats working capital while you wait for customers to pay back their acquisition cost.
The Growth Map
Cross the two dimensions and you get your marching orders:
- Healthy ratio + fast payback → scale aggressively
- Healthy ratio + slow payback → fix cash timing first (deposits, annual prepay, cheaper channels)
- Weak ratio + fast payback → fix retention/LTV — churn reduction compounds: cutting monthly churn from 5% to 3% lifts a 2.5:1 ratio to ~4.2:1 with zero new spend
- Weak ratio + slow payback → fix fundamentals; do not scale
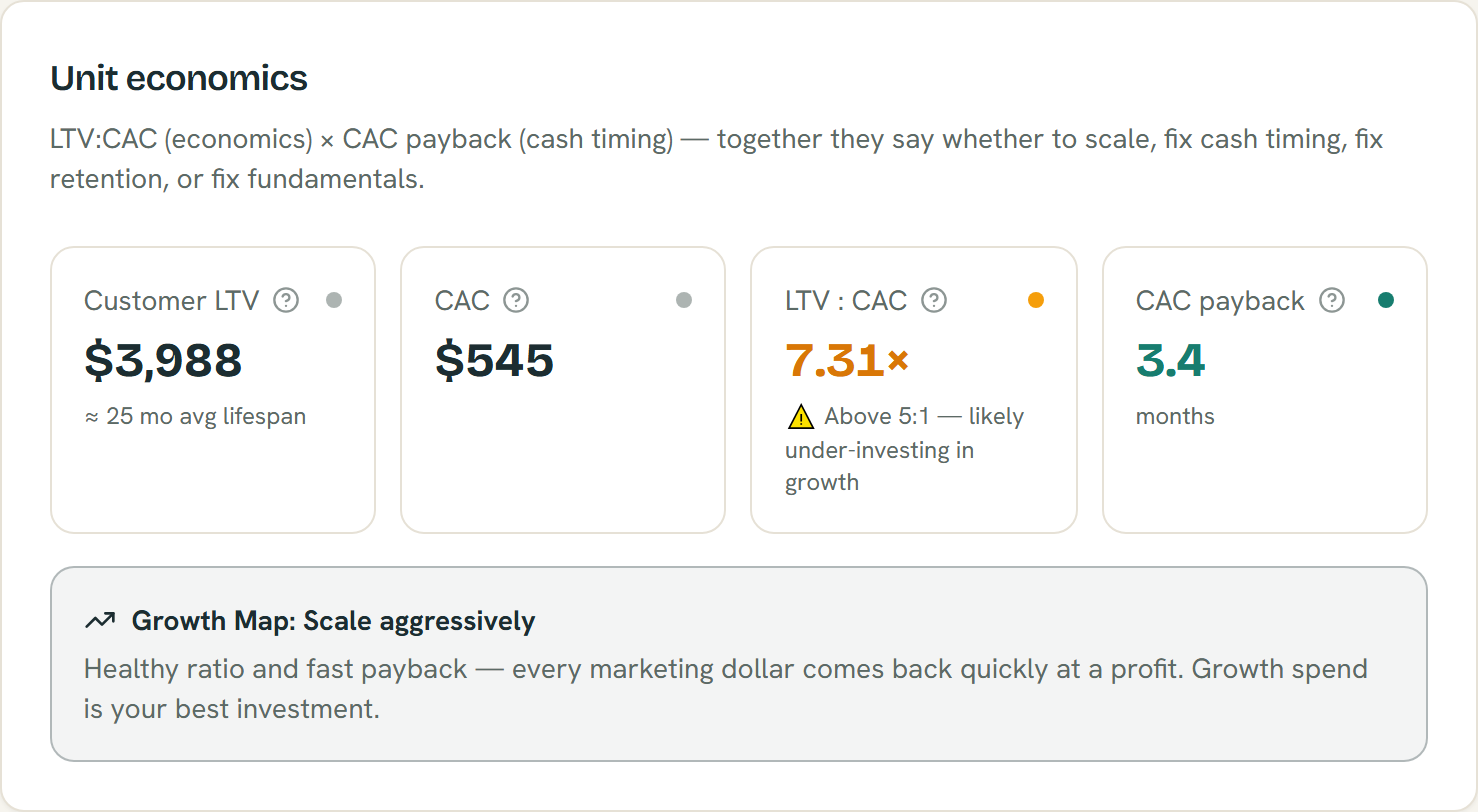
LTV, CAC, the ratio, and payback graded from five inputs, with a Growth Map verdict — example figures; estimates for planning, not advice.
Our Growth Calculator computes all of this from five inputs, grades each number, places you on the Growth Map — and then models the levers (churn cuts, price increases, more spend at your current CAC) against your business valuation, so you can see which fix creates the most enterprise value per dollar.